Our family loves traveling to Colorado each summer. This year, we passed through Leadville and Minturn, two old mining towns that remind us of what life was like in the 1800s. With an average life expectancy of 47, the pioneers traveling across the west in horse and buggy had to rely on their instincts (like grandpa’s knee) to forecast changes in weather patterns. Today, we have nearly doubled that life expectancy and can predict patterns by the day or week.
Recently, I learned of three entrepreneurs who created a weather app called Dark Sky. The iOS and Android app costs $4 and can predict rainfall or snow by the minute up to an hour in advance. The pioneers who built this app are not meteorologists, rather they are data scientists who utilized free radar information from the National Weather Service to predict outcomes more precisely. Soccer moms and dads can now tell a referee it’s going to rain in six minutes. If you ever venture outdoors…you’re welcome!
As an 86-year-old start-up, Holmes Murphy recognizes the only way we can help our clients Think Ahead is to embrace technology to create change in our industry. As we shared in our last “Understanding ART” webcast, “if better is possible, then good is no longer an option.” It’s why we are relentlessly focused on investing in our business to help clients forecast potential adverse outcomes and develop risk strategies to avoid, reduce, or transfer loss.
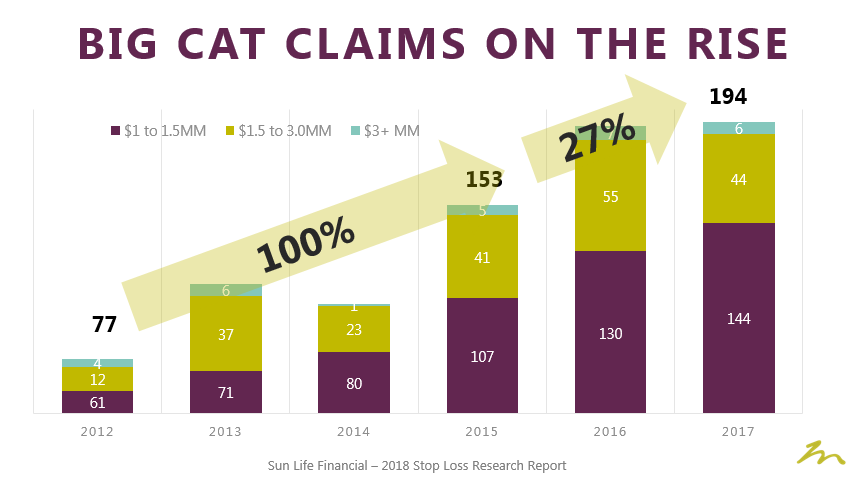
Each year, our employee benefits group reviews a health data set comprised of 4.2 million covered lives representing over $7 billion in health spend since 2012. Self-funded employers in the study ranged from 50 to over 100,000 covered employees. The good news in the 2018 report is that claimants over $1 million (what we call the ‘Big Cats’) increased by only 1 percent. This is hardly anything to cheer about, though, since $1 million claimants are up over 127 percent over the last 5 years.
What types of claims become Big Cats? Consistently, cancer remained the most dominant disease, accounting for about 27 percent of all stop loss claims, with leukemia, lymphoma, and multiple myelomas running second. Kidney disease ranked third, with premature babies and transplants rising to the number four and five positions, respectively, based on stop loss reimbursement. The likelihood of having any specific stop loss claim in any given year is 87 percent. The Big Cat claimants average 2 percent of your group, but account for 20 percent of stop loss reimbursements.
These large loss claims seemingly appear out of nowhere on the paid claims report and serve as lagging indicators. In the same way Dark Sky found a better way to predict the weather, our clinical analysts and medical doctors know which leading indicators correlate to next year’s large claimants. If your broker/consultant has your predictive analytics stuck in the Wild West, ask a Holmes Murphy representative how to predict and plan for disease with precision…and see if they will give you a “CLUE” (Clinical Learning and Understanding Engine)!
The post Health Plan Analytics Stuck in the Wild West? appeared first on Holmes Murphy.